Working edited summary — source and scope. This page is based on the March 16 Zoom recording and automated captions, then lightly edited for readability. Quoted speech should be checked against the linked full transcript or video before being relied on verbatim. Bracketed passages are editorial paraphrases, not quotations. Participants' statements reflect their own views; factual claims and proposed follow-ups on this page have not all been independently verified.
Summary with selected quotes: This document combines direct quotes with editorial summaries for readability."Text in quotes" — verbatim or lightly editedⓘ
[Bracketed summary text] — condensed paraphrase (hover to see original wording)
For the raw automated transcript, see the full transcript page or markdown file.
📑 Table of Contents · Jump to Part
👥 Speakers (12 participants)
David Reinstein
The Unjournal · Organizer
Peter Hickman
Coefficient Giving
Matt Lerner
Founders Pledge
Daniel Benjamin
UCLA/NBER · Author
Miles Kimball
CU Boulder · Author
Ori Heffetz
Cornell · Author
Caspar Kaiser
U of Warwick · Evaluator
Michael Plant
Happier Lives Institute
Samuel Dupret
Researcher
Julian Jamison
U of Exeter · Facilitator
Dean Jamison
DALY Co-author
Joel McGuire
Happier Lives Institute
Part 1: Opening & Stakeholder Perspectives
David Reinstein sets the workshop context, then Peter Hickman (Coefficient Giving) and Matt Lerner (Founders Pledge) present their organizations' frameworks for valuing wellbeing outcomes.
Welcome & Workshop Goals
📜 Full transcriptDavid Reinstein The Unjournal#
"Thank you so much for coming. [We're pleased to have everyone here.] We're trying to keep to a strict schedule, so that people can jump into the sessions they're interested in."
"I'm an economist, I'm the founder of The Unjournal. I'm not an expert in this area, so please don't let me dominate the discussion, although it's something I've been thinking about quite a bit."
- "Foster communication—what is it that we need to resolve between ourselves and can resolve, and what do we agree on?"
- [Beliefs elicitation session for "high-value Bayesian updating"]
- "And, you know, ultimately, better choices, particularly over interventions and funding in low-income countries."
The focus here is different: "What are the best ways to measure and compare the relative benefits and cost-effectiveness of different interventions, particularly thinking about well-being? [Bed nets vs. CBT vs. cash transfers in LMICs.]"
"We're not trying to set a firm scientific precedent, necessarily. Policymakers need to make choices now and want to know what their best options are."
Proposed premises:
- "Well-being is an important goal—though we might disagree about how measurable it is."
- "Self-reports carry some information. They're probably not totally uninformative."
- "These extreme representative-agent assumptions will be violated in some way, so showing a violation will not be highly informative to us or to policymakers."
"What we're worried about is: what measurement approaches lead to better decisions, and how much do the violations matter?"
Coefficient Giving's Framework
📜 Full transcript📊 Hickman's slides — Coefficient Giving's framework (click to expand)
Peter Hickman Coefficient Giving#
"I'm from Coefficient Giving, which, if you haven't heard, is the new name of Open Philanthropy. And I wanted to set the table a little bit by talking about our current framework for valuing outcomes."
[Coefficient Giving reached $1 billion in giving last year, with a mission to help others as much as possible.] "Part of the DNA is not picking certain cause areas initially, but being open to whatever helps others the most."
Their framework focuses on causes that are: "Important, so affecting a lot of people, affecting them a lot. Neglected, not just being covered by everyone else. [And] tractable, so we can make a difference."
On the "CG dollar": "Our unit of impact's the Coefficient Giving dollar, which is defined as the value of giving $1 to someone with an income of $50,000 a year. So basically, you can think about that as the baseline—we just give our donors' money to people in high-income countries, and everything else we would do is compared against that."
"Our bar is high. We need an SROI of 2000× in order to make the grant."
On income: "An easy way to get, like, 100× return is just to give money to people in low-income countries who might be 100 times poorer than $50,000 a year, and you'd immediately have a 100×."
On health: [They value DALYs at $100,000 CG dollars—their key assumption for comparing outcomes.]
Where the $100K/DALY came from: [They triangulated from preference studies between income and health, VSL literature, wellbeing effects, and GiveWell's values.] "If you look at it, you'll see there's a pretty big range of numbers you get out from the value of statistical life literature."
On subjective wellbeing: "There's definitely more to life than income and health, and we don't want to just categorically say we're not going to value people feeling happier about their lives." [He sees it as a potential unifying framework for comparing any outcomes.]
The practical question: "Would a grant that focuses on self-reported well-being, that isn't cashing out in income or in health, plausibly be above our bar? So that's kind of... when we have that kind of case in hand, then it becomes more practically important to really figure out what we think about this institutionally."
Their concerns: "The crux is—on my end, and I think others on my team would share—is a worry about experimenter demand: that if we get increases in self-reported well-being, it's because that's what people thought that they should tell the surveyors and experimenters. And then just kind of general concerns about scale use."
Founders Pledge's Wellbeing Journey
📜 Full transcriptMatt Lerner Founders Pledge#
"I work at Founders Pledge, I run the research team, I've been there for almost 5 years. [When I started, we were 3 people—now we're 17.] Our way of approaching well-being has maybe not kept pace with the needs of a growing team."
Where we started (2021): "We had a very small number of interventions that were, in principle, well-being focused, and primarily they were mental health, depression, anxiety interventions. [About 2-3 of these.]"
"The cost-effectiveness analyses were just very, very straightforwardly using disability weights to estimate the DALY cost of major depression. [This means picking mild, moderate, or severe from the disability weights.]"
"One thing that transpired when we started to do a few re-evaluations was just this issue that, like, the cost-effectiveness started to look different depending on how you decided to linearize, and whether you picked mild, moderate, or severe."
The principle: "There are already existing mental health and well-being measurement instruments. Is it possible to find some way to measure [interventions in standard deviations of mental health], rather than try to make them interconvertible with having a toothache?"
"I use the toothache example because we came to the view, based on some but not very extensive data, that certain types of conditions are systematically over- or under-weighted in the disability weights."
Joel McGuire's contribution: "Joel published a paper [in Nature Human Behaviour] that I found fairly convincing. The basic idea was, look, on different measurements of mental health and subjective well-being, you can basically have a consistent valuation for standard deviations in terms of income doublings."
Their approach: [They converted WELLBY → income doublings → lives saved → DALYs, then backed out DALY-to-WELLBY.] "So we had, sort of, two sides of a triangle, and then we filled in the third to make it so that all of those different are interconvertible."
When they use native units: "In cases where we felt there was strong reason to suspect that disability weights are underestimating the effect, we use native units. Oral pain is one example where if you look at it in terms of disability weights, it looks not so useful to work on, but if you look at it in terms of well-being, it looks a lot more promising."
Open questions:
- "This linearization—if you do linearize, it suggests weird things about the scales. Mostly, I've been comfortable with this because the actual movement across both scales is so small that the conceptual issue with the linearization doesn't arise."
- "This nagging uncertainty as to just how convertible all these different scales are—is one standard deviation on a depression instrument really the same as one standard deviation on Cantril's ladder?"
- "For converting to WELLBY SDs, we use SDs from the World Happiness Report. I don't know how much to trust those at country level, or whether they're applicable to a depression intervention in a rural village."
The optimism: "If we could get to a place of more confidence and a more deployable methodology, then I do think there's a horizon of stuff that we could evaluate that we can't currently evaluate that effectively. When we look at stuff outside the sphere of depression and anxiety—so, like, schizophrenia—then I feel that we are somewhat unsure how to look at stuff like that right now."
Part 2: WELLBY Reliability Discussion
Caspar Kaiser outlines the four key concerns about WELLBY validity. Miles Kimball and Ori Heffetz discuss how scale use correction dramatically changes income coefficients.
The Four Concerns
📜 Full transcriptCaspar Kaiser U of Warwick#
"I'm an assistant professor at Warwick Business School, have been working for most of my academic career on questions of well-being measurement. I'm also the chair of the board of the Happier Lives Institute, but all the views that I'm expressing here are strictly mine, and are with pretty large probability, divergent from those of HLI. Michael and I disagree on a great many things, though not all things."
Two axes to consider:
[There are two sets of concerns:] statistical assumptions and philosophical considerations.
"Under what conditions will the WELLBY pick out what we care about? If we're consequentialists and welfarists—believing only effects on welfare matter for determining goodness—then we say the WELLBY measures that. But under what conditions is this true?"
- Comparability — "If an intervention changes the numbers people report, did it change how they use the scale, or did the latent underlying construct actually change? Only the latter validates the WELLBY."
- Linearity — "The difference between 3 and 4 might not equal the difference between 7 and 8 in underlying wellbeing terms. If so, it matters greatly whether we're moving 3s to 4s or 7s to 8s."
- Neutrality — "For quantity-vs-quality comparisons, we need a neutral point: at what level would we be indifferent about a life continuing? Grim, but really key."
- Right concepts — "Life satisfaction questions embody a substantive philosophical view—roughly: global desire satisfaction. But many other views exist. Many of you, including myself, might be hedonists. And in that case, answers to a life satisfaction question might come apart from a question about hedonism."
On interventions and scale use: "The entire statistical machinery that's been developed in these papers directly applies to, you know, people doing RCTs. And probably what we should just be doing is asking questions about people's memories of past life satisfaction and vignette questions, and maybe calibration questions in these RCTs. Like, that would seem like the obvious thing to do."
On practical implementation: "All you need is two vignette questions. The minimal thing to do for... to implement at least Dan Benjamin's method is two vignette questions. That's the minimum you need."
Critical point: "Every other metric—income doublings, DALYs, QALYs—has concerns that roughly map onto this same structure. We just don't worry about them because they're older."
Scale Use Correction and Income Coefficients
📜 Full transcriptMiles Kimball CU Boulder#
"I think it's helpful to not get hung up on cardinality as if it's a technical question, because I think it's just as much an ethical question. If we had—if people understand the scale as it is, then you can ask them their attitudes about inequality on that."
"So this question of what's the appropriate curvature is really a question about inequality aversion for measures of well-being like this, and I think that would be a very useful thing to do. So anyway, I'd encourage us not to get hung up on it as a purely technical question, although there are technical issues in measuring inequality aversion on a scale like this."
Scale use correction matters in less obvious ways:
"If you care about inequality in measured wellbeing, you'll count a corrected point as worth more for someone at a lower level. But you can't know if someone has a lower level on the common scale without correcting for scale use first."
Ori Heffetz Cornell#
"The 'happiness regression' approach: you regress those answers to the question—rate yourself on a ladder from 0 to 10, or what's your life satisfaction from 0 to 10—on a bunch of features of the respondents, among which is their log income. And other things. So, for example, employment status."
"By coefficient ratios, you can price things—find indifference between X dollars and having a job." "And so this has been used to price all sorts of things that we can't price. Unemployment is one important example."
"We show in the paper that Dan will present later, and Caspar will discuss, that while scale use correction doesn't change the sign of things—so with or without scale use correction, unemployment is a bad thing, pretty bad, you know, large negative coefficients, and income is a good thing, large positive coefficients—it does dramatically change the ratios."
"In one example, we have the leading example with our data set that we collected, with, I think, around 10,000 respondents on the Understanding America panel. We show that you can change the ratio, so how you price unemployment in money could change by a factor of 5 if you correct versus the raw data. That's a big deal. That's a project that moves up five-fold when the funders here consider which project to evaluate."
Question wording matters: "It actually matters which question you asked. Sometimes little changes in the wording of the question could affect what time scale did you ask me about. So, one question, I would focus about the past few days or week, another question, I'll focus on the past year, or maybe my entire life. And this also makes dramatic differences, again, sometimes in order of magnitude. Because if I was answering about my entire life, one intervention is not going to move me much. If I was focusing on this week, one intervention, even with short-run effects, would move me a lot."
Part 3: DALY-WELLBY Conversion Discussion
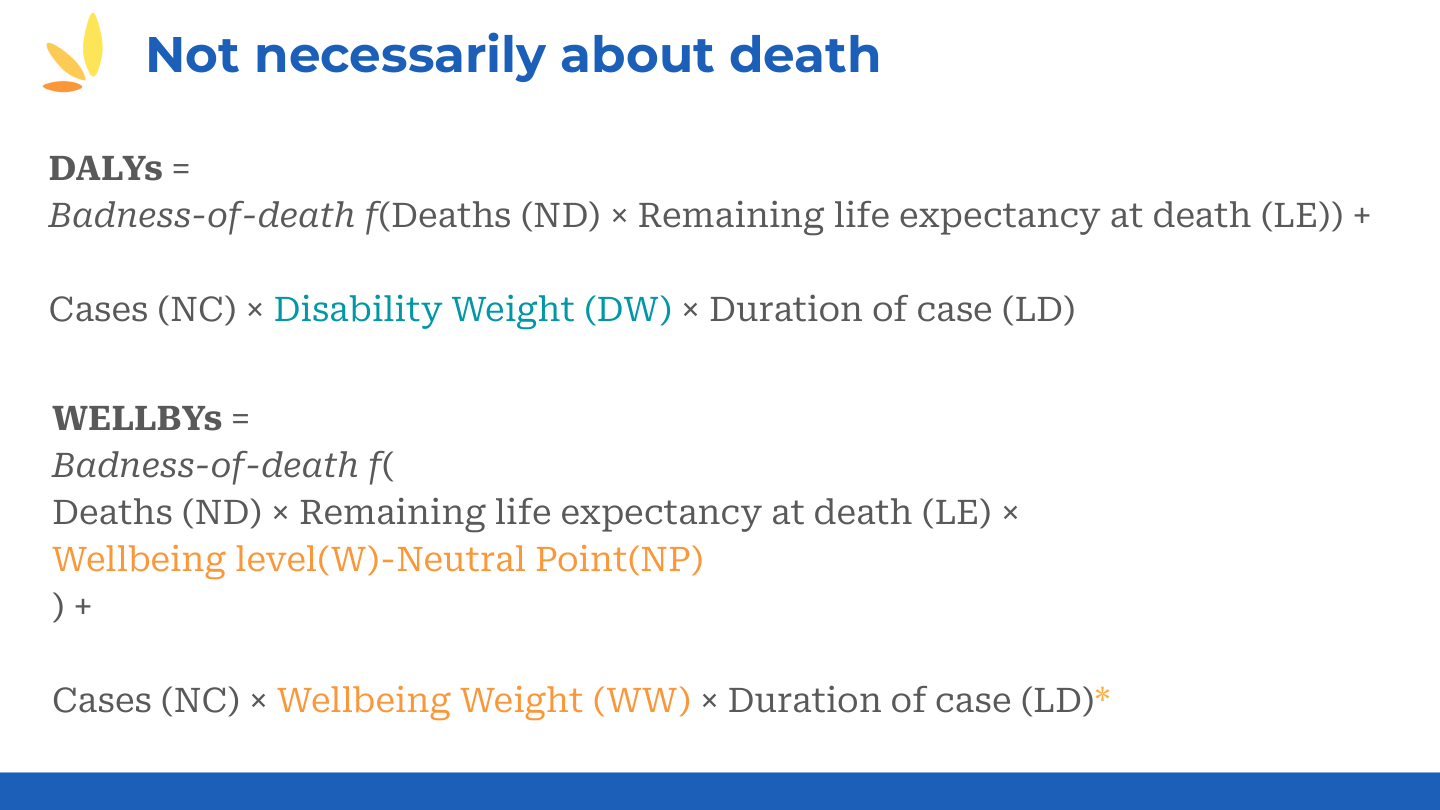
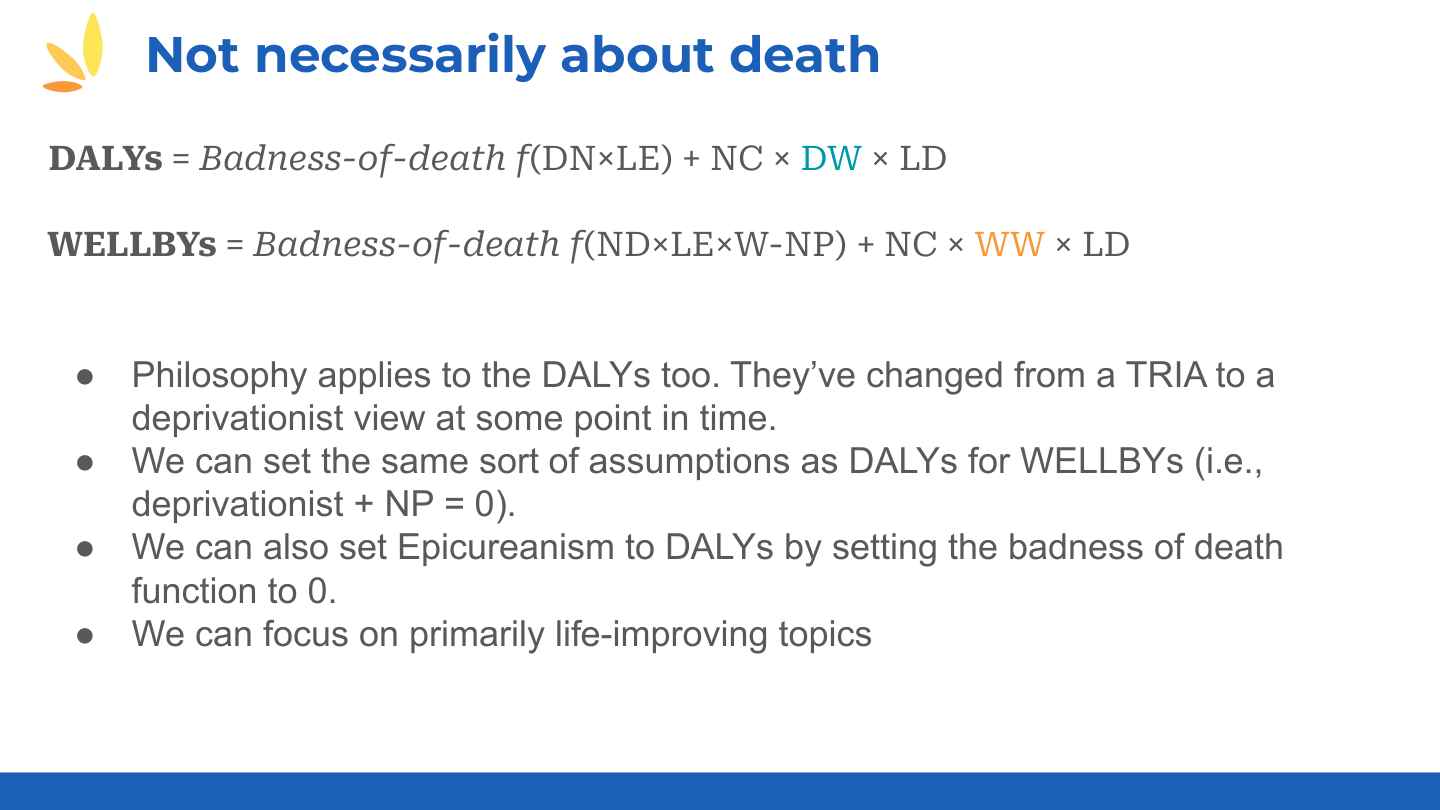
Samuel Dupret explains the fundamental differences between DALYs and WELLBYs. Dean Jamison shares the history of DALYs and current limitations.
The Core Difference Between DALYs and WELLBYs
📜 Full transcriptSamuel Dupret Happier Lives Institute#
"The core thing here is that we are quantifying well-being over time." [On WELLBY SDs:] "At the Happier Lives Institute, when we do evaluations of cost-effectiveness of charities and interventions in low- and middle-income countries, we don't have these rich data sets using a 0-to-10 well-being scale. There's lots and lots of RCTs on different scales."
[So they convert to standard deviations—standard meta-analysis practice—then convert to 0-to-10 scale.]
"The core difference is: what's the weight that you give to conditions between these two things? One is doing well-being, one is doing health."
"The other difference is how these things are obtained. The DALY weights are obtained by the general public, who doesn't necessarily have the condition, making pairwise health judgments. [They ask: which is less healthy, depression or cancer?] Whereas for WELLBYs, we use self-reports—so it's the people with the condition saying how satisfied they are with their lives."
Affective forecasting problems: "People making judgments about how bad different conditions are, when they don't have these conditions, are likely to make mistakes about how bad a different condition is to live with."
"Research finds: people rate moderate mobility issues as bad as mental health issues in disability weights. But ask people who have these issues about their life satisfaction—it's actually way worse to have a moderate mental health issue."
Strange DALY findings: "In different versions of the DALY weights, the difference between having cancer with or without treatment is often very, very small. And that just seems very strange, as a health state." "Also: blindness is not weighted very highly, because it's 'about well-being and not about health'—but if you're blind and that affects your relationships, your wealth, and all sorts of different things, well-being would capture that."
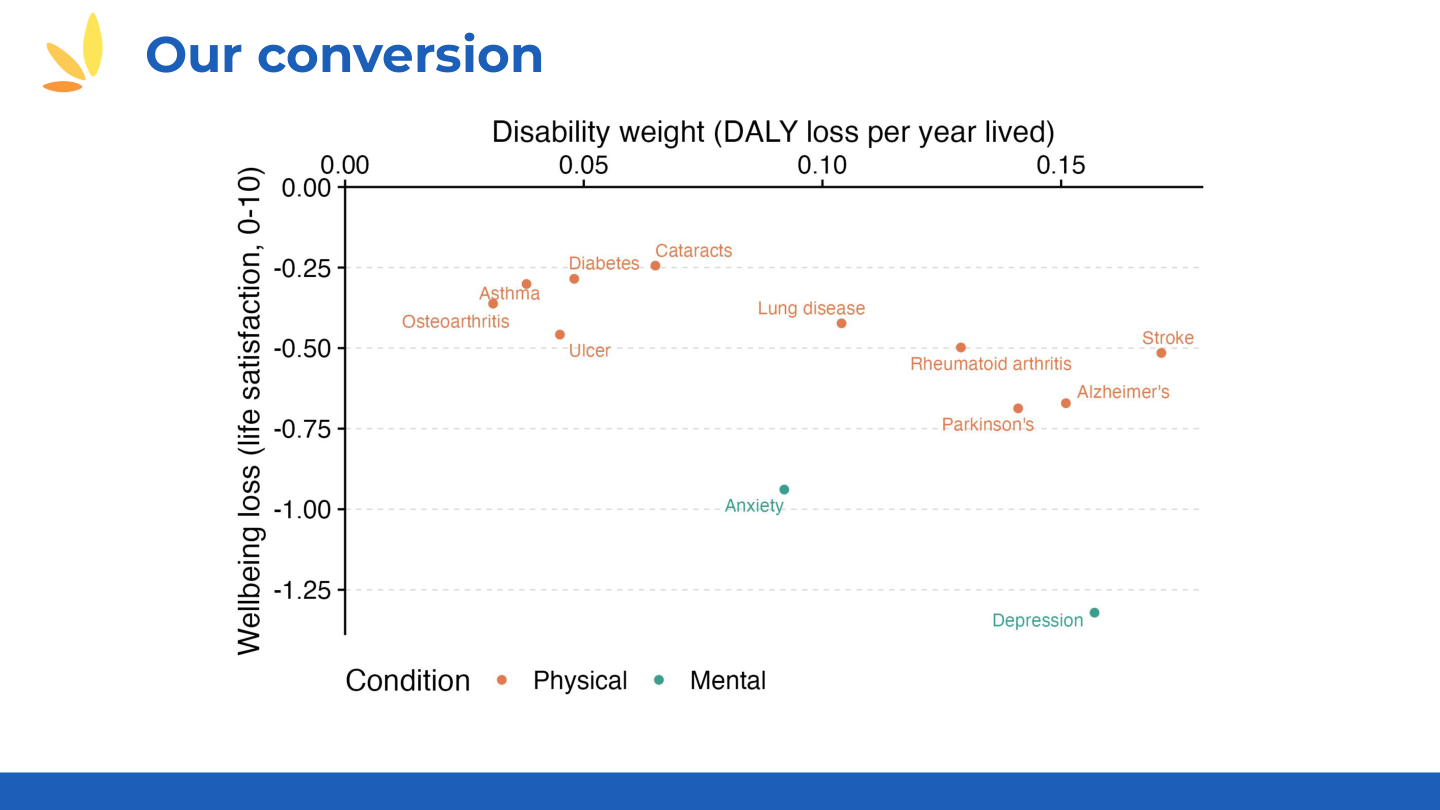
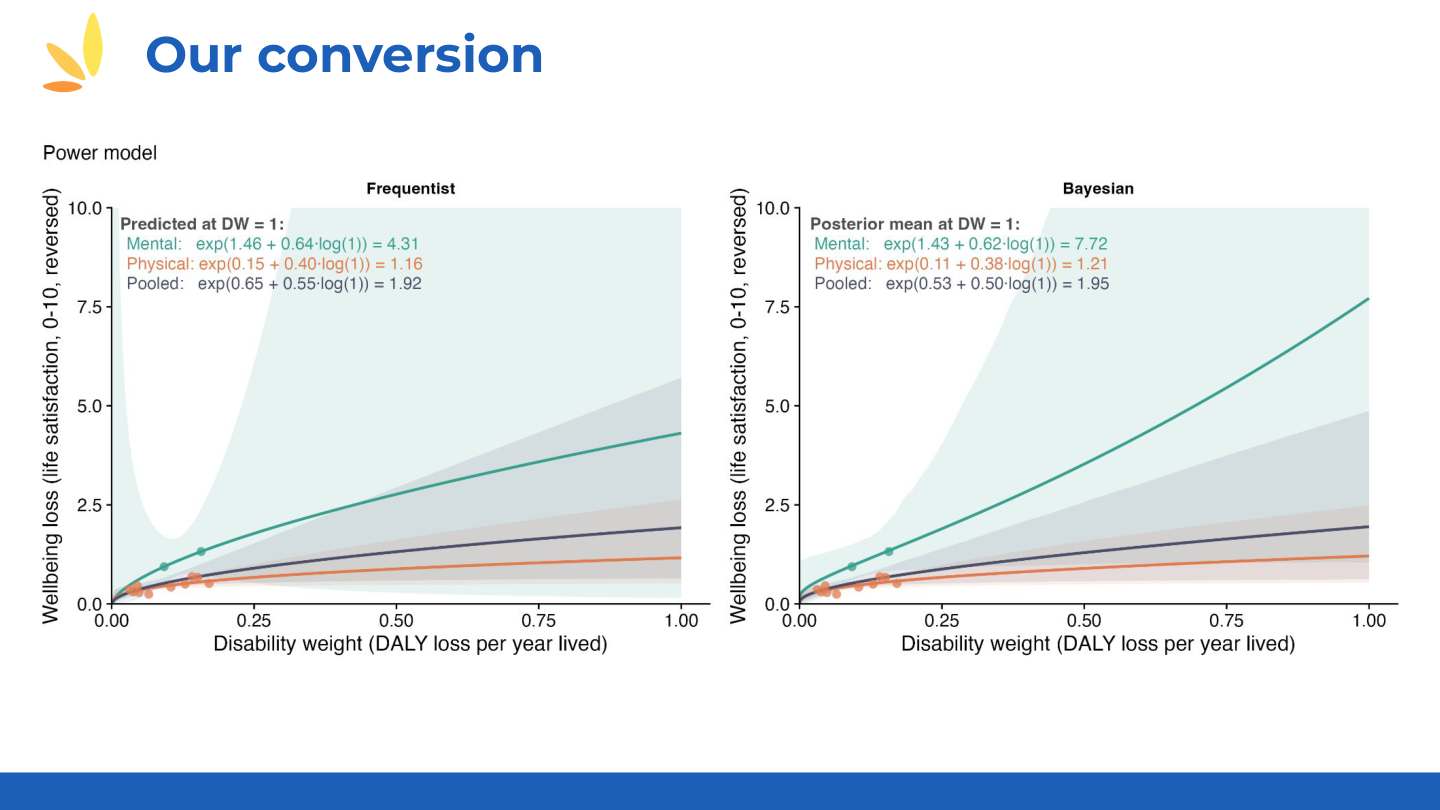
The empirical evidence: "We used data that the Happiness Research Institute, which is not us, collected from the SHARE panel—all the Europeans—and they have data on life satisfaction for different health conditions." [They compared life satisfaction coefficients to disability weights for 16 conditions.]
"You can see the disability weight doesn't go very high. The maximum would be 1, so this is not very high. And then this is the loss in well-being. The condition that has the biggest loss in well-being is more than one point on a 0-to-10 scale: depression. And you can see there seems to be two of these that have more effect on well-being than the others, and these happen to be the mental health conditions."
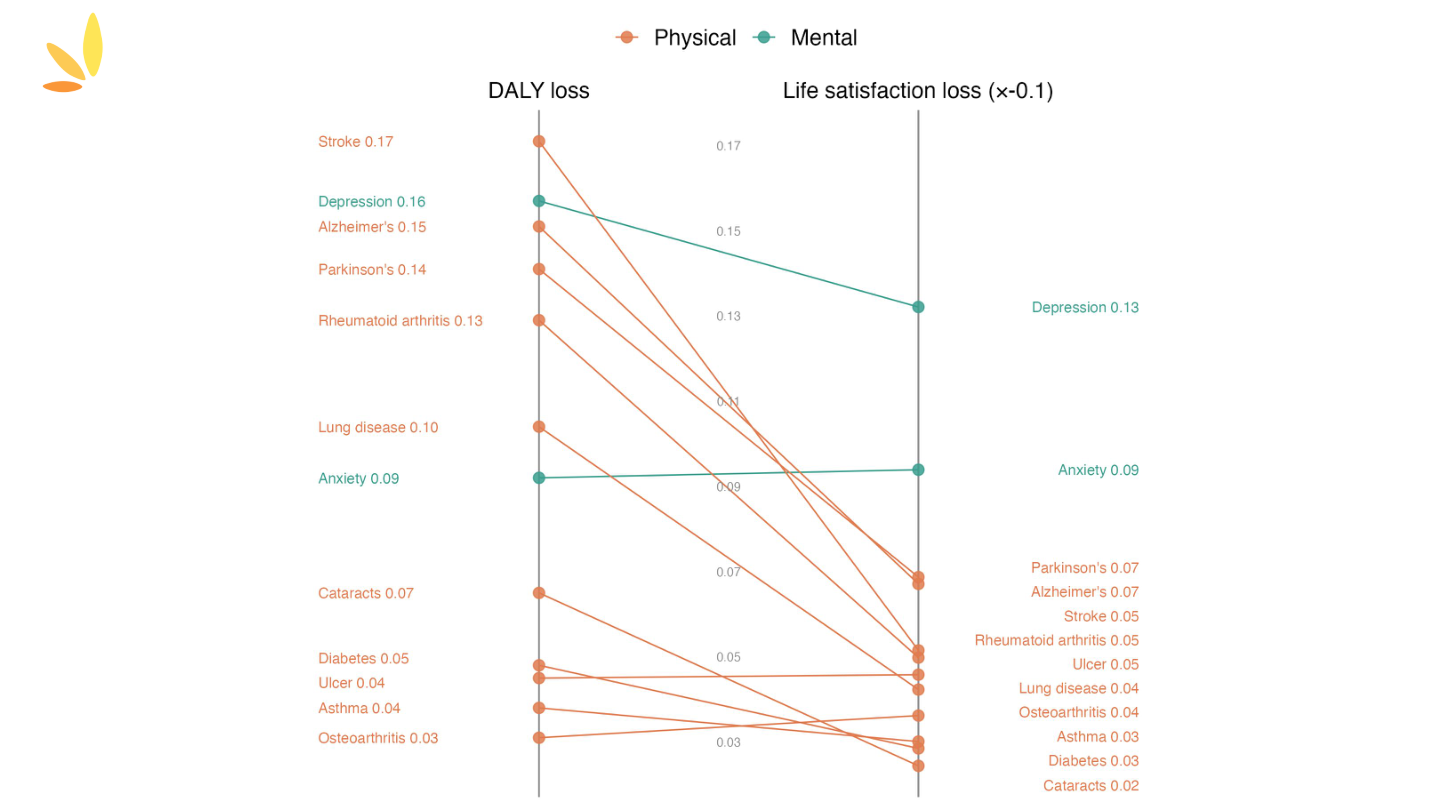
"If disability weights and WELLBY weights were the same, you'd get straight lines. But there's quite a lot of movement—mental health conditions shift dramatically."
📊 Figure: Disability Weights vs Life Satisfaction Loss (click to expand)
Key finding: Mental health conditions (depression, anxiety) show >1 point life satisfaction loss on a 0–10 scale, while physical conditions with similar DALY weights show much smaller losses.
📊 View slope chart visualization
Source: HLI analysis using SHARE data (European panel, 45+) and GBD disability weights.
📄 View full HLI presentation (PDF) →The Origin of DALYs
Julian Jamison U of Exeter
My father happens to be visiting—Dean Jamison, who helped originate DALYs and was lead editor of the Global Burden of Disease. He's not a big fan of DALYs now.
Dean Jamison Co-author, Global Burden of Disease
"I'm a co-author of the first published Global Burden of Disease using DALYs, and have followed that literature subsequently."
"The disease burden measurement has ended up in a somewhat different place than the use of DALYs for economic evaluation or cost-effectiveness evaluation. Mostly in practice around economists using for economic evaluation, discounted DALYs—so a child death is worth 30 DALYs, whereas the Global Burden of Disease has a child death worth 70 or 80 DALYs."
"So you can't talk about using cost-effectiveness as a way of judging how much you're reducing burden of disease, because the DALY has evolved very substantially."
"I've just been embarked on an exercise for the Lancet, which has a Commission on Investing in Health, which I chair. And we're dealing with non-fatal outcomes much more substantially than we have before."
"I examined what I thought were the 25 most important non-fatal outcomes. Blindness, deafness, major depressive disorders, manic depressive illness, dental caries... Pretty much anything that looked fairly big, but things like menstruation appear on that as a clear major use of health services."
"So even before you get to the question of comparison with mortality risk... there's a serious incompleteness if you're thinking about healthcare, to the whole YLD structure. My colleagues are not happy with me about this conclusion, because the YLD and the DALY are well-established as the measure both of burden and the cost-effectiveness variable. But it's very much on our minds."
"As we get seriously into trying to look at all forms of non-fatal conditions addressed by healthcare systems, it's quite clear that the YLD is just not going to do that."
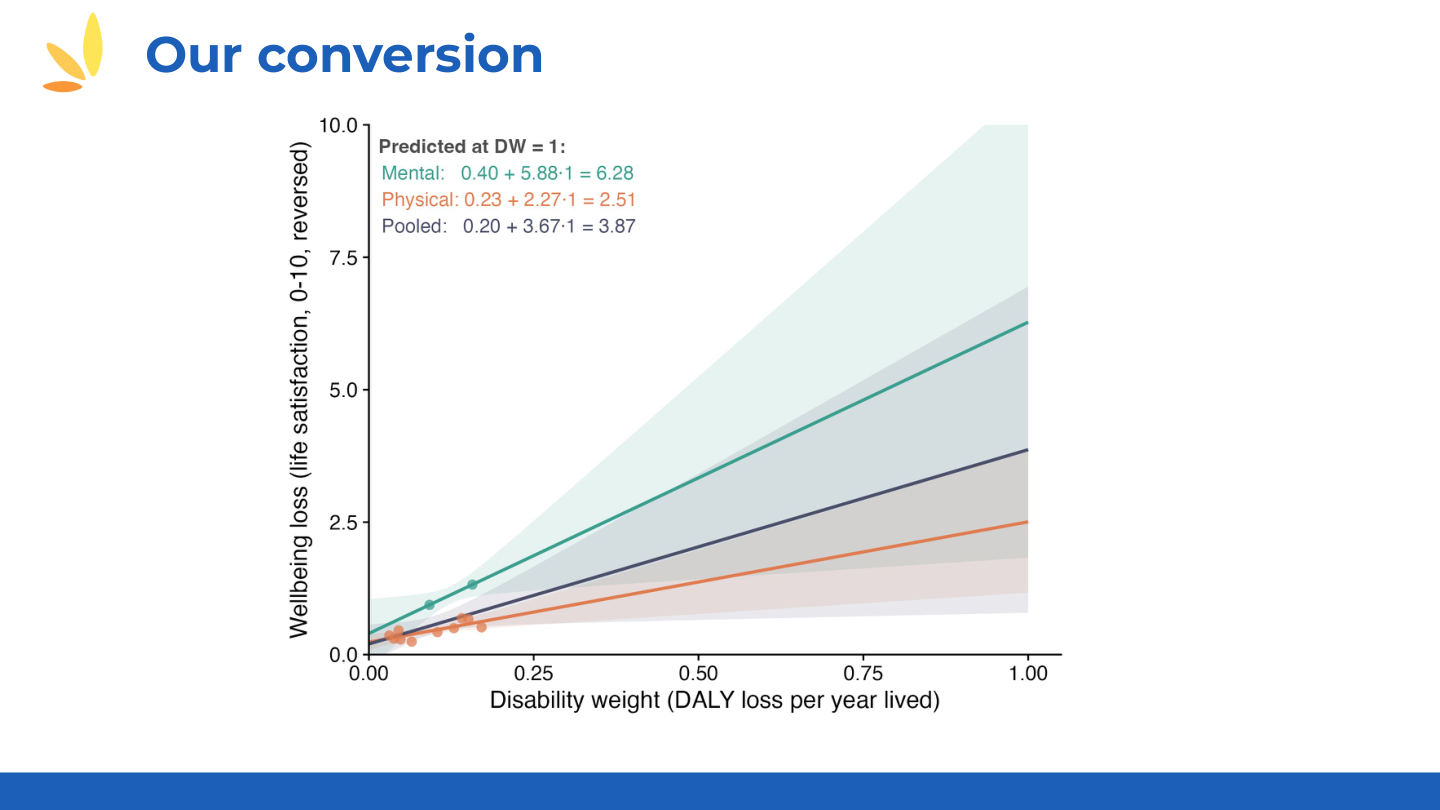
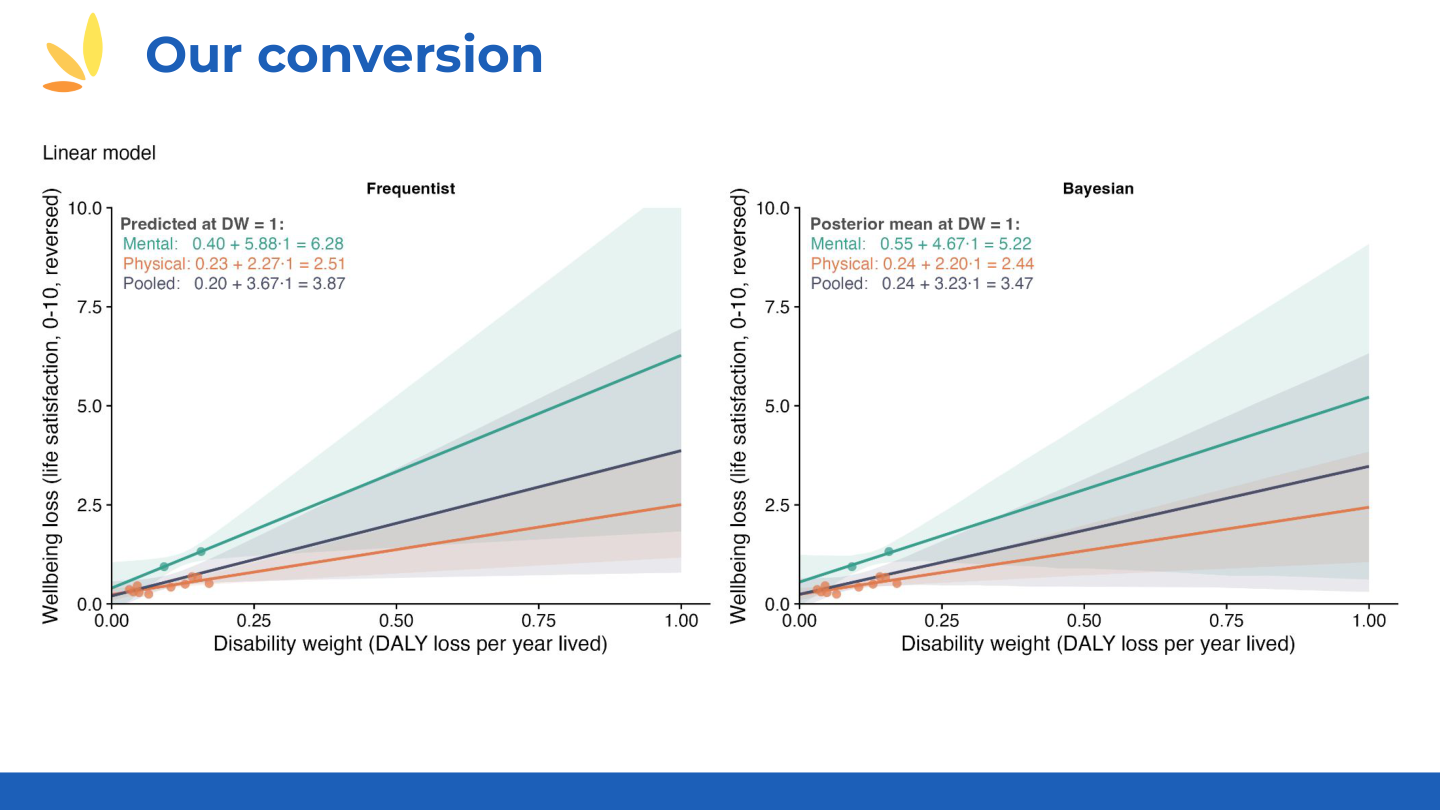
📊 HLI Regression Models: Converting DALYs to WELLBYs (click to expand)
HLI's regression approach for deriving WELLBY weights from SHARE panel data:
📊 Additional regression specifications
📊 WELLBY estimates and aggregate weights
Source: HLI presentation by Michael Plant, using SHARE panel data.
Part 4: Benjamin et al. Paper Presentation
Daniel Benjamin presents the scale use heterogeneity paper: the problem, calibration questions, and the correction method.
Scale Use Heterogeneity: The Problem and Solution
Daniel Benjamin UCLA/NBER
"Thank you for having us. This is joint work with Kristen Cooper, Ori Heffetz, Miles Kimball, and Jinan Zhao."
The topic: "If David says 70 and Valentin says 80 on life satisfaction, we'd think Valentin is more satisfied. But maybe those numbers mean the same thing because they're using scales differently."
Our data: [In the new version, they collected data from the Understanding America Study—a nationally representative internet panel of ~10,000 people.]
The question: "Over the past year, on average, how would you have rated how satisfied you are with your life?" [0-100 slider scale]
The fundamental problem: [People differ in their true situation AND in how they translate that situation to a response. We can't disentangle these without an empirical tool.]
Two types:
- Vignettes — "There's a little story about a person. And then the question is: If this situation described your life during the past year, on average, how would you have rated how satisfied you are with your life?"
- Visual calibration questions — "How dark is this circle?" [0-100 scale]
[They use three vignettes (low/medium/high life satisfaction scenarios) and three visual questions.]
Why consider cross-scale correction? [Maybe you only have calibration questions for a different dimension. Also, you might worry about biases in how people answer particular vignettes.]
📊 Figure 4: Calibration Question vs SWB Correlations (click to expand)
Key finding: People who rate calibration questions (vignettes) higher also report higher life satisfaction. Panels C and D show vignette-based correlations (r=0.39 for means, r=0.46 for standard deviations).
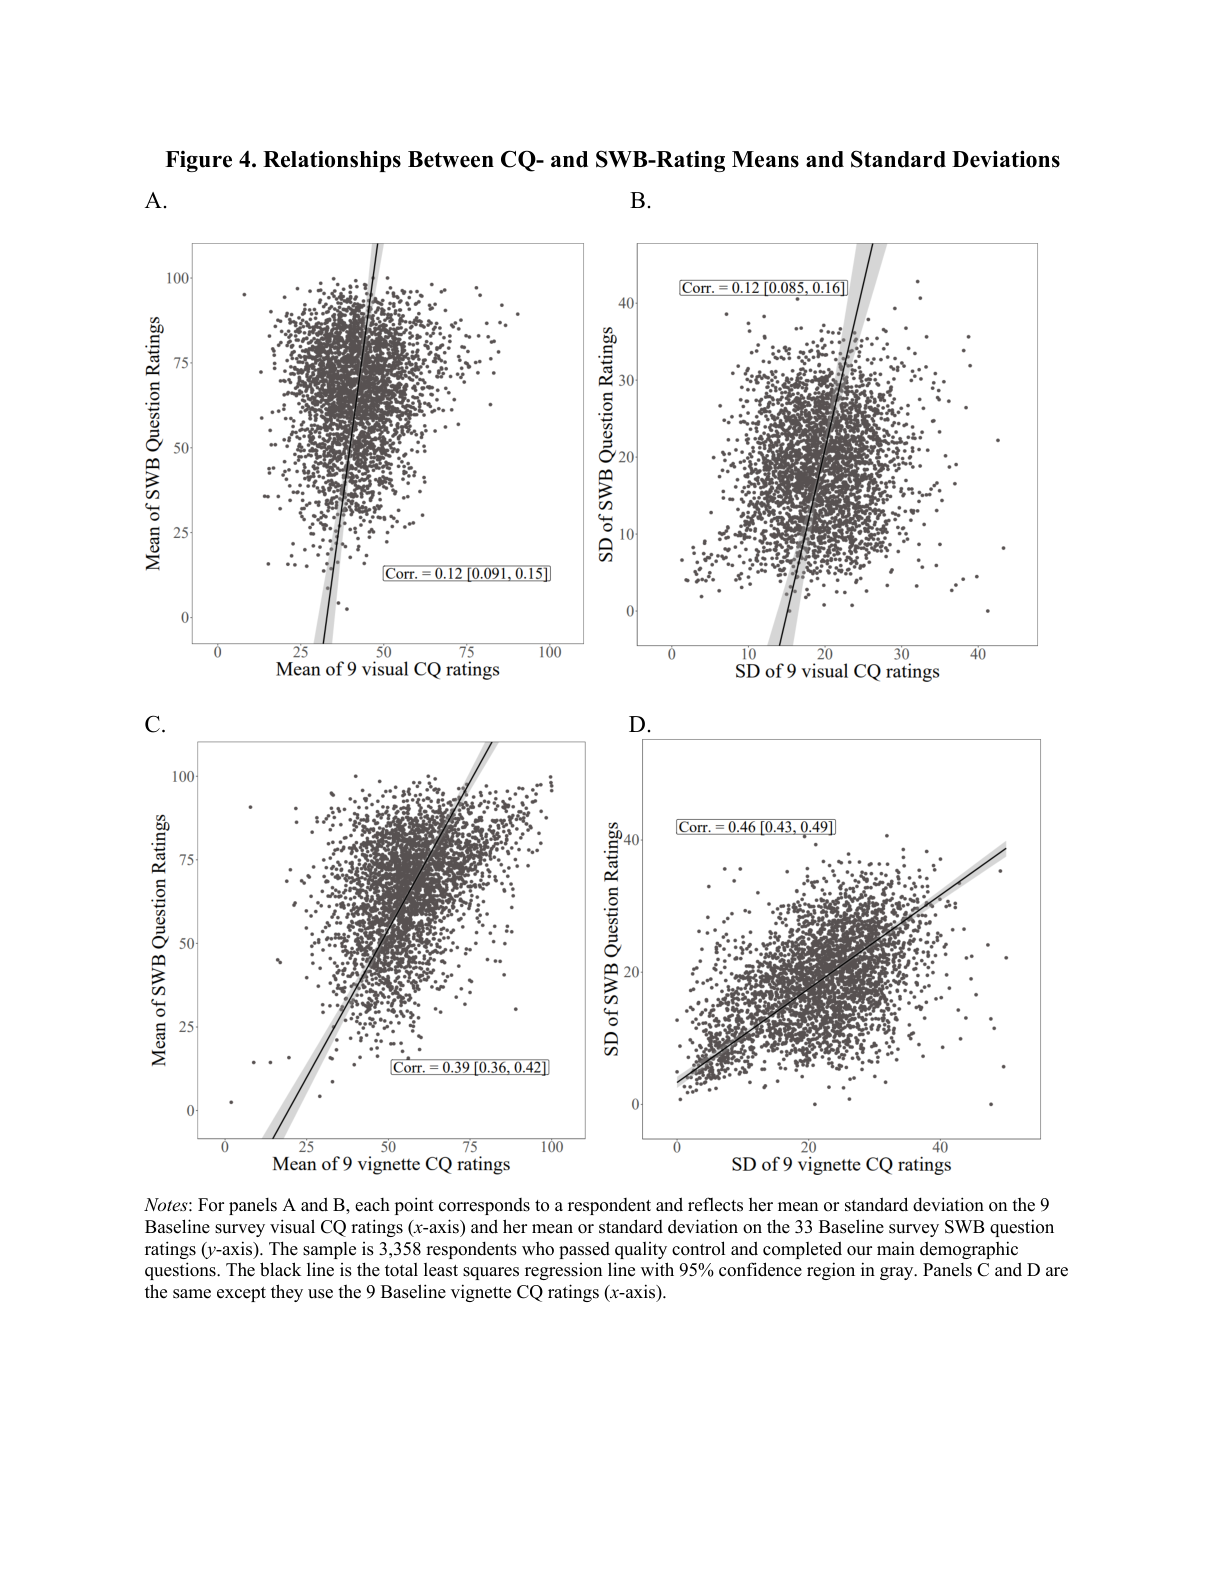
Reading the figure:
- Panels A & B: Visual calibration questions (circles) vs SWB ratings
- Panels C & D: Vignette calibration questions vs SWB ratings
- Each point = one respondent; black line = regression fit
- Positive slopes confirm scale-use heterogeneity exists
Implication: If two people report the same life satisfaction number, they may actually differ in true satisfaction—the one who rates vignettes higher is likely less satisfied than their number suggests.
Key findings:
- Finding 2: Changes in vignette ratings correlate with changes in life satisfaction over time. [This matters because the economist's solution—panel fixed effects—only works if scale use is fixed over time. It's not.]
- Finding 3: [For height and weight (where we have objective measures), vignette ratings predict self-ratings even controlling for actual height/weight.] "We think that's really, you know, pretty powerful evidence that scale use heterogeneity really is driving the differences in the self-reports."
The Correction Method
Daniel Benjamin UCLA/NBER
"The point here is gonna be that it's actually very simple and transparent."
Step 1: [Estimate each person's translation function—an intercept (shift) and slope (stretch)—using their calibration question responses.]
[We convert everyone to a "common scale" (sample mean). With linear translation functions, results like coefficient ratios are invariant to whose scale you pick.]
Step 2: [For each person, create a "scale-use-only benchmark"—evaluate their estimated translation function at the sample mean. This captures only scale use differences.]
Step 3: [Regress the scale-use-only benchmark on covariates. These coefficients are adjustments to naive regression coefficients.]
| Covariate | Unadjusted | Same-Dimension Corrected |
|---|---|---|
| Age (demeaned) | 2.49 | 3.46 |
| Unemployed | -5.83 | -7.21 |
| Log income | 3.65 | 5.93 |
| Married | 5.21 | 5.47 |
Validation: [For height and weight, correlations between objective measures and subjective ratings go up after scale use correction.] [Height: 0.49 → 0.60; Weight: 0.23 → 0.51]
Part 5: Evaluator Discussion
Caspar Kaiser presents his evaluation of the Benjamin et al. paper, followed by technical discussion between the authors and evaluators.
Caspar Kaiser's Evaluation
Caspar Kaiser U of Warwick · Evaluator
The two core contributions:
- [Introducing calibration questions (including visual ones like circle brightness)]
- [An econometric approach that handles both shifts (different average levels) AND stretches (different amounts of scale used)]
- Response consistency — [Do people use the same scale for calibration questions as for rating their own lives?]
[Easy to believe for visual questions.] Harder to argue for abstract vignettes. - Common perception — [Do people perceive calibration stimuli the same way?]
Easy for visual questions. [Harder for life satisfaction vignettes—if I'm low-income, I might fill in unmentioned economic aspects differently than a rich person.]
On the validation exercise: "I really like the validation exercise, where you essentially show, like, hey, you know, once we are adjusting for these scale use differences, we're actually better at correlating, for example, objective and subjective height and weight. Like, this is... this is, to me, strong evidence that we're improving, in some way, our subjective measurement." [Make this finding more prominent!]
What I'd want to see:
- [Sensitivity analysis varying calibration questions]
- [Extension to LMIC contexts—we know nothing about scale use in intervention settings there]
- [Software packages (Stata, R, Python) for practitioners]
Technical Discussion
Daniel Benjamin UCLA/NBER
[On the response consistency / common perception trade-off: In the new paper, we've made major progress on theoretical foundations.]
[Many violations of common perception are actually fine. "Fill-in-the-blank bias" (people inserting their own situation into vignette gaps)—we were worried about this, but it doesn't invalidate the approach unless there's complete overwriting (ignoring the vignette entirely).]
Miles Kimball CU Boulder
[Our method is transparent—the adjustment comes from a simple regression of the scale-use-only benchmark on covariates. In contrast, CHOPIT (the older method) is opaque.]
"Our approach is invariant to heteroscedasticity. CHOPIT is very sensitive to it."
Caspar Kaiser U of Warwick
"The key thing is: we know nothing about interventions. In observational datasets, yes, you can do adjustments and they make a difference. But what matters for this workshop is: if I give people cash or psychotherapy or bed nets, will they change how they use their scales?"
Miles Kimball CU Boulder
"If you ask about an objective outcome both objectively and subjectively, with calibration questions, you can identify these separately. That's something we're very interested in pursuing."
Part 6: Beliefs Elicitation Session
David explains the belief elicitation exercise, covering the focal case and key questions about WELLBY reliability and DALY-WELLBY conversion.
David Reinstein The Unjournal
"So, why are we doing this belief elicitation? And this is sort of a trial. We're working out the kinks, trying to see what will work in terms of eliciting the beliefs of stakeholders and experts."
Goals:
- [Capture prior beliefs before evidence presentations, then measure updating]
- [Aggregate expert opinion to inform decision-makers]
- "I think doing this helps focus our ideas. I didn't realize it until you were forced to frame a precise question."
- [Measure workshop impact—did we actually shift beliefs?]
On measuring impact: "It's very hard to measure the impact of research work. The meta-research work that we're doing, but this is the ambitious approach. To try to see, are we actually... before people read the thing versus after, does it actually shift their beliefs? And if they can even identify how those beliefs enter into their policy choices and their value, well, then you've actually got a tip-to-tail, you know, purported measure of your impact. It's not easy, but one has to try."
Challenges: [Posing questions correctly is challenging—even quantitative researchers find it difficult to state beliefs in quantified form with credible intervals.]
"Suppose Founders Pledge is considering whether to recommend a donation of $100,000 to either StrongMinds or seasonal malaria chemoprevention. They have substantial evidence, from a variety... a few different types of measures, including well-being surveys on these different interventions, which are in maybe similar but not identical context, maybe in different countries, affecting different groups."
Key questions:
- "How reliable is the linear WELLBY measure, stated in general terms, for the focal context?"
- [What conversion factor between DALYs and WELLBYs should be used?]
- [Would calibration questions meaningfully change the cost-effectiveness ranking of top interventions?]
Caspar Kaiser's question: "It says 'relative to other available measures.' Which is different from 'other possible measures.'"
Reinstein: "Yeah, that's good feedback. One is: if I have to make a decision now, which should I use? The other is: if I could collect other measures and took into account the cost of collection, which would be better?"
Part 7: Practitioner Panel & Wrap-Up
Ori Heffetz offers four key reflections. Matt Lerner and Peter Hickman share funder takeaways. Michael Plant responds on HLI's practical approach.
Ori Heffetz's Reflections
Ori Heffetz Cornell
"Let me say four things."
First: "We started the day with the funders. And I kept asking myself, are they all utilitarian? They never said anything about that. We talk about measures and metrics and stuff, and I thought, wait a second. Are they not prioritarian? Is $1 the same, regardless of who you give it to?" [These ethical questions are distinct from methodological ones. We probably focused on second-order things while skipping the first-order question.]
Second: [There are two types of practical advice:]
- Given current data and constraints, what's best?
- What 2-5 additional questions should go in your next RCT?
[Our paper is mostly geared toward new data collection. But we could also discuss extrapolation—using rich-country data for poor-country contexts.]
📊 Table: Practical Recommendations for Practitioners
From Benjamin et al.—recommendations organized by effort required and research readiness:
| Ready to Apply | Needs More R&D | |
|---|---|---|
| No Extra Survey Items |
• Use adjustment factors from published studies • Apply demographic-based corrections |
• Cross-country extrapolation • Pooling adjustments across studies |
| Add 2–5 Survey Items |
• Include vignette questions in RCTs • Visual calibration questions (e.g., "how dark is this circle?") |
• Develop LMIC-specific vignettes • Test cross-domain calibration validity |
Key takeaway: Adding just 2–5 calibration questions to your next survey or RCT can substantially improve comparability. The cost is minimal; the payoff is substantial bias reduction.
Third: "There is a fundamental difference between QALY and DALY... and the well-being. Which is, they don't rely on a question. They don't rely on a question. We can calculate them with data... with administrative data. But once you move to questions... you want to make sure that everybody answers the same question."
[We have work showing: people understand questions differently. The broader the question, the more interpretation.] "You ask people, do you have leg pain? Then probably everybody answers the same question. You ask people to put yourself on a ladder and think about your whole life, you get a whole lot of different interpretations."
[These interpretations are systematically associated with demographics and could be associated with treatment.]
[But these metrics aren't ready for full delegation. Eventually we want to automate—have metrics we can trust. We're heading there. But for now, human judgment with all its biases is another imperfect input alongside the metrics.]
"Sometimes we will see that if we use health-related measures, the mental health things come at the bottom, but if we use wellbeing, it comes at the top. What to do? Well, what to do? To do what we've always been doing: to think. And to think, and to think about other things, and to listen to other people, and to decide in that way."
Funder Reflections
Matt Lerner Founders Pledge
"One reflection is... I'll quote you, Ori, that we're in trouble. I think we're in a different kind of trouble."
[Getting to higher confidence about WELLBY measurements is possible with the right attention—being careful about details of specific interventions and studies. The trouble for my team is we don't have that time and energy.]
[Maybe doing better requires more time and energy than we have available. Though I'm optimistic about careful AI deployment for automating some conversion work.]
"The other reflection I have is... the unavoidability of the core philosophical question of, like, what is the outcome of interest, actually? And... I'm now less confident than I was at the beginning that, for instance, types of things like the evident correlation between affective mood and subjective well-being are evidence that we're all just kind of getting at the same underlying quantity of concern."
"Maybe I need to talk to Michael about moral philosophy some more."
Peter Hickman Coefficient Giving
"I think my vague worries and ideas about subjective well-being measurements have become more precise through seeing some of the specific concerns and how they're being addressed in the Benjamin et al. paper."
[We didn't discuss the badness of death point—probably the key crux for whether we'd focus on subjective wellbeing interventions versus life-saving interventions.]
"I would like to see some direct thinking about whether people are just going to give you higher answers after an intervention because they want to please the research team. And that might inflate results. So, that's kind of still an outstanding crux."
Michael Plant on HLI's Approach
Michael Plant Happier Lives Institute
"It's really fascinating hearing this, but I notice as I'm doing it, I'm having a slightly out-of-body experience with Matt and Peter being like, 'Oh, this sounds like... I don't know how we would do this. How would we implement it?' I'm like, we're doing it! We built a car, we're driving a car. Now, it might be that the car is imaginary, and in fact, it doesn't really go anywhere. But this is stuff that we've been forging ahead with."
"I would be absolutely delighted to talk to Founders Pledge, Coefficient, as you're now called, in greatest detail, to tell you how do we actually try and solve these problems. Now, you might not agree with our answers... but we probably have answers to some of these things, or at least have thought about them."
[We take a (perhaps) simple approach: wellbeing is what matters, it can be reasonably well measured by subjective wellbeing. In doing this, we have to break a huge amount of rocks—determining wellbeing weights for this and that.]
"We're hoping that those rocks have to be broken once. And really, part of the reason we exist is that much, much bigger, more significant players in the space can make use of this."
Matt Lerner Founders Pledge
"There's sort of a clarifying point for the academics, as we sort of bridge the academic versus donor world. When I say it's, like, hard for us to learn to drive the car, what I sort of mean is: HLI's and our estimates of cost-effectiveness for these different interventions vary right now by a maximum of maybe a factor of 2 to 5×. And it's kind of a big deal in terms of allocation. But in the scope of all philanthropy, it's kind of a narcissism of small differences thing."
[My hope is we can wash out even those differences—that a team without Michael's expertise can derive a heuristic approach.]
"What I'm coming away thinking: maybe the heuristic approach is not well-suited. This is complicated."
Closing
David Reinstein The Unjournal
"I think we've potentially learned about these methods and potentially had some questions answered. I think there were some questions that were raised that weren't sufficiently addressed that hopefully we can continue to raise and continue this discussion asynchronously."
Outstanding questions:
- [How much does scale use change in response to interventions? (This seems crux-y)]
- [Evidence on linear scale use against gold standards—how do people trade off movements between 7-8 versus 1-2?]
Caspar Kaiser
"Thank you, that was great."
David Reinstein
[Thanks to everyone for being part of this experiment. I hope we've understood each other's work, questions, and cruxes better, enabling more valuable communication going forward.]
End of Workshop: 4:32 PM ET
Transcript edited for readability. Minor corrections appear in [brackets]. Housekeeping remarks and technical interruptions removed. Timestamps indicate approximate position in original recording.